YCharts Splits Charting Capabilities, Preps Expanded ETF, Mutual Fund Data

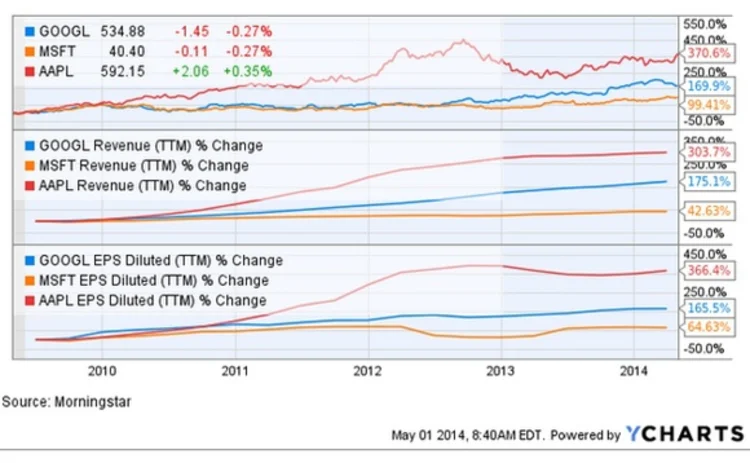
Today, Thursday May 1, YCharts introduced the ability for users to split out and compare data on multiple metrics across multiple charts, whereas the platform previously plotted all of a user's chosen data on a single chart. YCharts chief executive Shawn Carpenter says this gives users greater control over how they can analyze increasingly complex sets of data.
While users will still be able to plot whatever metrics they want on the same chart, Carpenter says the complexity of many users'
Only users who have a paid subscription or are part of a corporate subscription are able to print or copy content.
To access these options, along with all other subscription benefits, please contact info@waterstechnology.com or view our subscription options here: https://subscriptions.waterstechnology.com/subscribe
You are currently unable to print this content. Please contact info@waterstechnology.com to find out more.
You are currently unable to copy this content. Please contact info@waterstechnology.com to find out more.
Copyright Infopro Digital Limited. All rights reserved.
As outlined in our terms and conditions, https://www.infopro-digital.com/terms-and-conditions/subscriptions/ (point 2.4), printing is limited to a single copy.
If you would like to purchase additional rights please email info@waterstechnology.com
Copyright Infopro Digital Limited. All rights reserved.
You may share this content using our article tools. As outlined in our terms and conditions, https://www.infopro-digital.com/terms-and-conditions/subscriptions/ (clause 2.4), an Authorised User may only make one copy of the materials for their own personal use. You must also comply with the restrictions in clause 2.5.
If you would like to purchase additional rights please email info@waterstechnology.com
More on Data Management
Where have four years of Cusip legal drama gone?
The IMD Wrap: The antitrust case against Cusip Global Services has been a long, winding road. Reb recaps what you might have missed.
LSEG files second motion to dismiss lawsuit with MayStreet co-founder
Exchange group has denied abandoning the MayStreet business in a new filing, responding to allegations put forward by former MayStreet CEO Patrick Flannery.
‘The end of the beginning’: Brown Brothers Harriman re-invents itself
Voice of the CDO: Firms who want to use AI successfully better start with their metadata, says BBH’s Mike McGovern and Kevin Welch.
Editor’s Picks: Our best from 2025
Anthony Malakian picks out 10 stories from the past 12 months that set the stage for the new year.
Market data costs defy cyclicality
Trading firms continue to grapple with escalating market data costs. Can innovative solutions and strategic approaches bring relief?
LSEG partners with Citi, DTCC goes on-chain, AI on the brain, and more
The Waters Cooler: Trading Technologies buys OpenGamma, CT Plan updates, and the beginning of benchmarking in this week’s news roundup.
AI & data enablement: A looming reality or pipe dream?
Waters Wrap: The promise of AI and agents is massive, and real-world success stories are trickling out. But Anthony notes that firms still need to be hyper-focused on getting the data foundation correct before adding layers.
Data managers worry lack of funding, staffing will hinder AI ambitions
Nearly two-thirds of respondents to WatersTechnology’s data benchmark survey rated the pressure they’re receiving from senior executives and the board as very high. But is the money flowing for talent and data management?


