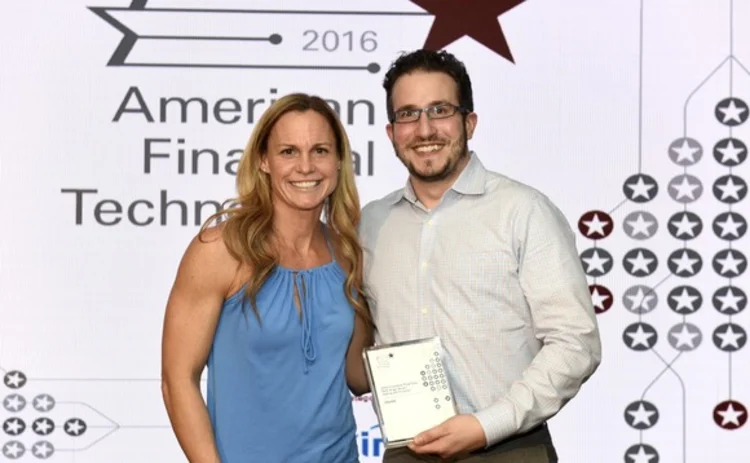
AFTAs 2016: Most Innovative Third-Party Technology Vendor: Trading and Analytics—ChartIQ
ChartIQ has been helping traders to make better decisions through its data visualization service

This was the thinking behind why ChartIQ was selected by this year's judging panel as the most innovative third-party technology vendor for trading and analytics at this year's American Financial Technology Awards.
It is worth noting, however, that this was not an easy win: Nine firms were in contention for the award in what proved to be one of the most competitive vendor categories on offer this year.
US-based ChartIQ was founded in 2012 and within four years it has established an impressive client base. Approximately 125 firms worldwide are using the firm’s flagship offering, Charting Library, to simplify their data-visualization processes.0
Its success has allowed the vendor to expand outside its Charlottesville, Va., headquarters: Three additional offices have already opened in New York, London and Cyprus to strengthen its business activities across the US and Europe.
What distinguishes ChartIQ from its competitors is the firm’s dedication to making developers’ work easier. Charting Library is an engine built in HTML5, utilizing a proprietary application programming interface (API) that eases and accelerates the process of integration to any platform.
What impresses most is the product’s scalability. Using a pixel-based charting architecture, based on HTML5 canvas and proprietary technology, users can add as many objects to their charts as required.
The product is also delivered as a software development kit (SDK) file, allowing users to build charts in the form, type and style they want. Charting Library’s major advantage, however, derives from the fact that developers can append, prepend, or overwrite any function inside the system without having to adapt the provided source code and develop separate software.
Charting Library has a number of data-visualization tools specifically for time-series charting that intuitively comingle macro, fundamental, and social and proprietary data in the context of charts across all asset classes, and it is one of the few data-visualization services currently on the market able to work seamlessly across desktops, tablets and smartphones.
The desktop version features a touch-compatible interface and improves overall performance through rendering algorithms, allowing traders to identify, analyze and execute trades swiftly and easily from any device. However, what impresses most is the product’s scalability. Using a pixel-based charting architecture, based on HTML5 canvas and proprietary technology, users can add as many objects to their charts as required.
Therefore, complex charts with multiple series indicators, drawings, unique user annotations and other visualizations can be produced without degradation or latency impinging on the end-user experience.
Only users who have a paid subscription or are part of a corporate subscription are able to print or copy content.
To access these options, along with all other subscription benefits, please contact info@waterstechnology.com or view our subscription options here: https://subscriptions.waterstechnology.com/subscribe
You are currently unable to print this content. Please contact info@waterstechnology.com to find out more.
You are currently unable to copy this content. Please contact info@waterstechnology.com to find out more.
Copyright Infopro Digital Limited. All rights reserved.
As outlined in our terms and conditions, https://www.infopro-digital.com/terms-and-conditions/subscriptions/ (point 2.4), printing is limited to a single copy.
If you would like to purchase additional rights please email info@waterstechnology.com
Copyright Infopro Digital Limited. All rights reserved.
You may share this content using our article tools. As outlined in our terms and conditions, https://www.infopro-digital.com/terms-and-conditions/subscriptions/ (clause 2.4), an Authorised User may only make one copy of the materials for their own personal use. You must also comply with the restrictions in clause 2.5.
If you would like to purchase additional rights please email info@waterstechnology.com
More on Awards & Rankings
AFTAs 2025: Best data provider—Allvue Systems
Product: Private Credit Intelligence
AFTAs 2025: Best IT team—TCW Group
Team: TCW Group’s Investment Technology Team; Project: Engineering Solutions—ABF and insurance launches during Aladdin stabilization
Buy-Side Technology Awards 2025 winner’s interview: 73 Strings
73 Strings’ win in the BST Awards 2025 Best middle-office platform category
AFTAs 2025: Most cutting-edge IT initiative—J.P. Morgan
Project: Vida Beta One
Buy-Side Technology Awards 2025 winner’s interview: S&P Global Market Intelligence
S&P Global Market Intelligence’s success in the first year the Best private markets data provider category has been on offer.
AFTAs 2025: Most innovative third-party technology vendor (operations)—AutoRek
Company name: AutoRek


