CQG Adds Visual Tools to Portfolio Monitors, Spreadsheet Displays
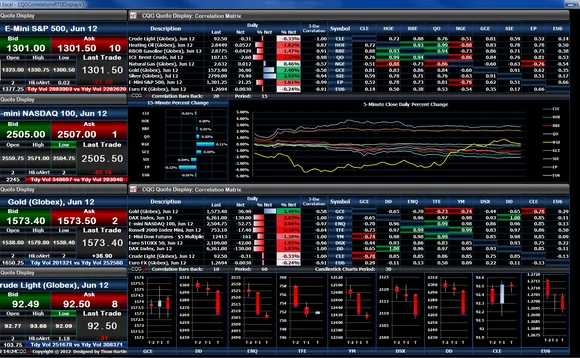
Market data, charting and trading software vendor CQG has added charts and data visualization tools to the Portfolio Monitor feature of its Integrated Client desktop, and now supports Microsoft Excel’s RealTimeData (RTD) function to provide tighter integration with CQG’s data, enabling clients to consume and analyze data in customized spreadsheets that act as data displays.
CQG added Portfolio Monitors to the Integrated Client desktop last year to enable users—primarily technical traders—to view
Only users who have a paid subscription or are part of a corporate subscription are able to print or copy content.
To access these options, along with all other subscription benefits, please contact info@waterstechnology.com or view our subscription options here: https://subscriptions.waterstechnology.com/subscribe
You are currently unable to print this content. Please contact info@waterstechnology.com to find out more.
You are currently unable to copy this content. Please contact info@waterstechnology.com to find out more.
Copyright Infopro Digital Limited. All rights reserved.
As outlined in our terms and conditions, https://www.infopro-digital.com/terms-and-conditions/subscriptions/ (point 2.4), printing is limited to a single copy.
If you would like to purchase additional rights please email info@waterstechnology.com
Copyright Infopro Digital Limited. All rights reserved.
You may share this content using our article tools. As outlined in our terms and conditions, https://www.infopro-digital.com/terms-and-conditions/subscriptions/ (clause 2.4), an Authorised User may only make one copy of the materials for their own personal use. You must also comply with the restrictions in clause 2.5.
If you would like to purchase additional rights please email info@waterstechnology.com
More on Trading Tech
Clear Street rolls out new BestEx algo platform
Clear Street has deployed BestEx’s new platform, giving it global execution reach, plus a host of other features built in.

Can Canada follow in the US’s footsteps in overnight trading?
Canadian marketplaces and trading venues are in a race to see who can first authorize overnight equities trading, but not everyone is convinced of its value.

‘Vibe coding is burning us out’
Vibe coding is rapidly spreading throughout the capital markets, and some are unhappy about it, while others believe the genie is out of the bottle. Engineers spoken to for this story share some choice words—and several expletives—about this new form of coding.

Broadridge-Nyfix, Delta Capita-Equilend, S&P-Ion, Trumid, and more
The Waters Cooler: A recap of the major tech and data news from the past week in the capital markets.

DTCC dives into public cloud
The clearing house has begun migrating its equities clearing and settlement systems to AWS, while its tokenization systems have migrated to Microsoft Azure ahead of their launch this fall.

Solving the last line of latency
Repurposed copper cables and hollow-core fiber can optimize latency even for firms who feel they’ve hit a ceiling, writes Vahan Sardaryan in this guest column.

LSEG’s FXall to launch credit-intermediated FX forwards service
Split Risk to allow buy side to tap best spot and swap prices to create forwards, and unbundle market and credit risk

APAC’s hidden opportunity is in the hands of wealth managers
Asia-Pacific’s financial firms have lofty growth ambitions that will come with high cost and complexity. To succeed, they’ll need a quality portfolio toolkit and a connected technology architecture, writes BlackRock’s James Verner.